Introduction to Corsi
Corsi is a basic, yet highly known, advanced statistic in hockey. It measures the number of shots taken (on goal + missed + blocked) and compares that with the number of shots given up (on goal + missed + blocked) when a player is on the ice. Corsi is often expressed in percentage. For example, a Corsi For % of 60% for player A means that when player A was on the ice 60% of shots attempted were by his team. The rationale for Corsi as a possession stat is that if player A’s team is attempting 60% of the shots when player A is on the ice, then player A’s team controlled – or possessed – the puck for ~60% of the time.
Overview of key shortcomings
While it still is indicative and directional, Corsi has its’ shortcomings. First, possession numbers are largely skewed by the team you play on. For example, as the worst puck moving defenseman on the best possession team, you might have a higher Corsi than the best puck moving defenseman on the worst possession team.
Second, possession numbers are skewed by the teammates you play with. As a defenseman, having a strong defense partner is sure to impact your own Corsi. Similarly, playing with skilled possession forwards will have a positive impact on Corsi.
Third, the quality of competition you face is also a factor. Facing off against 3rd liners is easier than top line opponents. You often see strong possession numbers on 3rd pairing guys (e.g., Schlemko in San Jose, Carrick in Toronto) – but who knows if they can maintain that production against top line opposition.
Finally, there are tons of other factors that will impact Corsi. To name a few: percent of shifts starting in the defensive zone vs the offensive zone, chemistry with your linemates, etc.
Looking at the Habs d-men with Corsi
These shortcomings make it extremely difficult and unreliable to use Corsi as a comparative metric between players on different teams (as well as between players on the same team). Let’s look at the Montreal Canadiens from 2016/17 as an example:
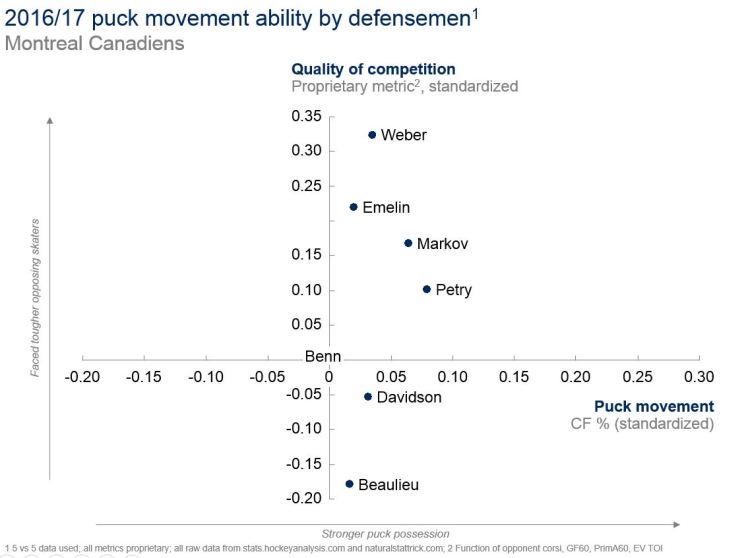
The chart above plots standardized CF% (x-axis) vs QoC (y-axis). You can quickly point out examples of how Corsi does not paint the full picture:
+ All 6 Habs defensemen (except Benn who joined at the trade deadline) have positive Corsi. Does this mean they are all solid puck movers? Not at all. Montreal was a very strong possession team in 2015/16 (52.5%) whereas Dallas (50.1%) was average. The strong team numbers have a positive skew on all Habs d-men whereas Dallas’ average team numbers don’t inflate Benn the same way.
+ In terms of Corsi, Davidson (51.2), Emelin (50.7), and Beaulieu (50.6) are very similar. Does this mean they have similar puck movement ability? Again, no. Moving past the fact that Davidson spent a good chunk of the season on Edmonton, this still does not account for quality of defense partner (Emelin spent most of the season paired with strong defenders in Petry and Weber) or % of shifts starting in the defensive zone (35% for Emelin, 33% for Davidson, 31% for Beaulieu).
Looking at the Habs d-men with our Puck-Moving Metric

Using our puck movement factor (PMF), some of these shortcomings get weeded out. We focus on relative corsi improvement, also considering quality of teammate (e.g., defense partner), percentage of shifts starting in the defensive zone, linemate chemistry, etc. This makes it more feasible to compare numbers across teams.
In the chart above, the fact that Jordie Benn spent most of the year on Dallas is factored in. Despite being on a team with weaker possession numbers, his individual ability as a puck mover is middle of the pack on the Habs blue line.
In terms of Corsi, both Markov and Petry were similar. Here we see Petry’s emergence as the Habs top puck mover in 2016/17, consistently driving team possession and making his teammates better.
Emelin, Davidson, and Beaulieu had similar Corsi numbers. We see from above that the conclusion that they were about equal as puck movers in 2016/17 is flawed. Davidson was much better at maintaining possession and helping teammates generate scoring chances.
The Verdict
Like any metric, our proprietary PMF isn’t perfect. That said, it does provide strong evidence of effective puck-moving / possession-driving defensemen, and can be used to compare players in different roles on different teams.
