Overview of QoC
Quality of Competition (QoC) is an important metric in hockey (in any sport, really). It’s a measure of the level of competition you face. It becomes increasingly important when trying to compare players who face different levels of opposition; i.e., the rationale being it’s easier to play against a 3rd line consistently than against a 1st line.
As we explored different blue lines, we saw examples of players that showed exemplary puck movement ability (e.g., PMF > +2.0) but in a sheltered role against generally weak QoC. Would they be able to exhibit that same possession ability against 2nd or top line opponents? Similarly, we see examples of players who struggle mightily to move the puck (e.g., PMF < -2.0) but regularly face top competition. Would they become top notch possession players in a reduced role? There’s no exact answer to either question.
Rather, QoC helps bring important context to the evaluation of certain players. As I mentioned many times, PMF is a strong indication of puck movement ability – which is paramount for defensemen in today’s NHL – but is no means the only metric to evaluate a player. QoC provides the context to that player’s performance and lends insight to the potential fit on a given team.
Consider Brayden McNabb (26, LHD) as an example. He posted strong (and improving) puck movement numbers (PMF +2.0 in 2016/17) despite playing against relatively lower QoC. Arriving at the conclusion that he’s a ready made top-4 D would likely be a stretch. Instead, one might conclude that Brayden McNabb is a strong 3rd pairing puck mover exhibiting high end possession ability against weaker opposition. Given his improvement YoY for the past 3 years, it’s reasonable to highlight strong potential and expect him to reach a steady top-4 role soon.
QoC in our analysis to date
Up until now, we’ve used opponent forwards Corsi For % (when they’re not on the ice vs the d-man in question) weighted based on ice time against the d-man in question. This is a solid indicator of QoC that provides context to the puck movement analysis we’re conducting (e.g., it’s easy to extrapolate from the graph whether a player faced top, middle, or bottom QoC).
We’ve gone ahead and refined the model to improve the accuracy and insights. To highlight the changes, let’s look at 2 examples.
Below is the Habs puck analysis chart using that QoC (please note QoC may vary slightly from previous graph due to small refinements in the model).

The context provided above is helpful. Weber and Emelin struggled as puck movers but faced the toughest competition. Petry was the Habs best possession driver but faced mostly 2nd line opposition. Benn and Beaulieu spent some time together on the 3rd pairing (reflected above). Davidson’s numbers are likely skewed from his time in Edmonton.
Refined metric
The primary area of focus was incorporating a measure of scoring ability / point generation as Corsi can be skewed by the team that forwards play for (e.g., Taylor Hall had a Corsi For % of 52.5% in 2016/17 playing for the Devils. Paul Byron had a Corsi For % of 54.3% playing for the Habs. Is Paul Byron a more dangerous forward than Taylor Hall? No one is suggesting that. But the Habs were a much stronger possession team than New Jersey, which explains that discrepency).
As a result, we layered in the opposition’s goal scoring ability per 60 minutes of ice time and primary assist generation per 60 minutes of ice time, again weighting by the amount of ice time they faced off. Here’s the result:

The biggest change that jumps out is how Weber separates himself from the pack. Anyone who watched the Canadiens this year is not surprised by this. Weber regularly faced off against the top opponents. To examine the numbers that drive this change:
The forwards Weber faced averaged 0.73 goals per 60 minutes and 0.59 primary assists per 60 minutes 5v5. This is ~15% higher than league average and reflects the shutdown role that coaches lean on Weber to fulfill.
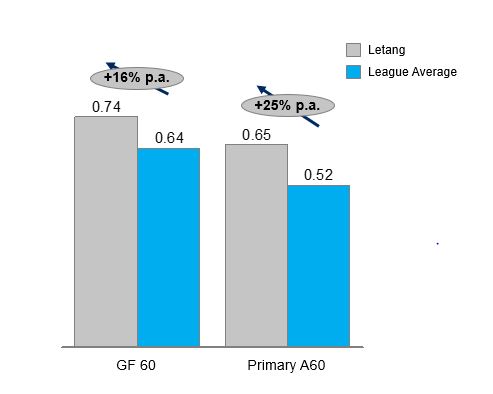
Another neat example is Kris Letang on Pittsburgh. While Letang’s average opponent Corsi is 3rd on Pittsburgh (still an indication of 1st/2nd pairing opposition), the GF60 and Primary A60 of the forwards he faces are highest on the team. This more accurately reflects Letang’s role as a workhorse who is used in all situations.
Below maps opponents Letang faces vs League averages
Verdict
Quality of Competition will continue to be a metric that carries high importance with no exact answer. When used for player evaluation, it provides helpful context behind a player’s numbers to date and helps project how that player may do in a similar/different role going forward. We believe that our refined metric brings more accuracy and balance to describing that context.
