An interesting exercise to test the applicability of our puck moving approach is to go back in time and look at previous free agency periods (as we now have evidence as to how some of those deals turned out). Would our puck movement metric have led GMs to different decisions? We explore by looking at two big free agent defensemen: Anton Stralman (2014) and Dan Hamhuis (2010).
As we often point out as a disclaimer, puck movement is only one piece of many that should be looked at when evaluating a player. That said, in today’s NHL, it is a critical ability to look for in defensemen.
Anton Stralman
When Stralman entered free agency as a UFA at the end of the 2013-14 season, his “basic” stats appeared underwhelming. He had just played for his 3rd team in 7 seasons (Rangers, Blue Jackets, Maple Leafs), he had only amassed 1 goal and 13 points in 81 games, and – at 5″10, 190 – did not bring the physicality that some GMs covet.
Our puck movement metric tells a completely different story.
Stralman (PMF of +3.95 from 2011-2014) was lights out as a puck-mover over his 3 years with the Rangers. He consistently made his teammates better, drove possession and helped generate scoring chances. While facing solid QoC (spent most of his time paired with Marc Staal on the 2nd pairing) – he performed as an elite possession-moving defenseman.
Consider the impact Stralman had – these numbers are over 3 years (large sample size):
WITH Stralman on the ice, Rick Nash, Derek Stepan, and Derick Brassard had CF% of 56.3%, 55.0%, and 57.8%.
WITHOUT Stralman on the ice, Rick Nash, Derek Stepan, and Derick Brassard had CF% of 50.6%, 50.3%, 48.7%.
That is serious impact. But with “basic” stats telling the story of a modest 1 goal, 12 assists, and +9 – Stralman’s dominance as an efficient puck-mover might slide under the radar.
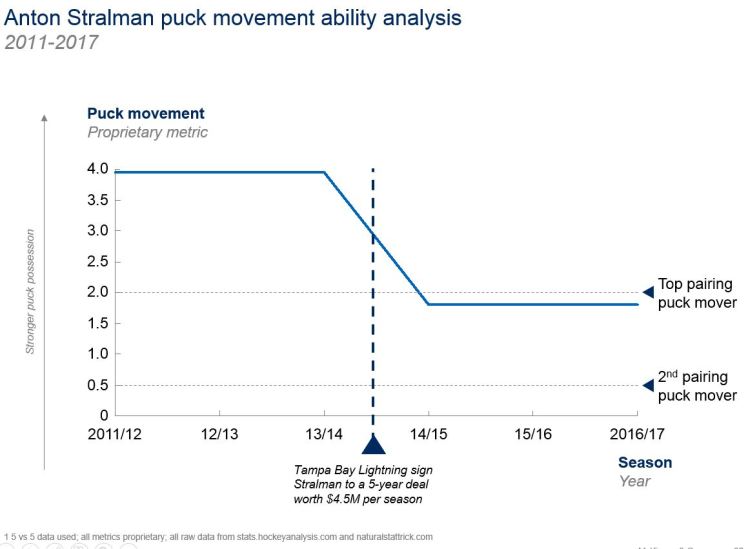
In his 3 seasons since being acquired, Stralman has continued to exhibit exceptional ability as a puck mover. You’ll notice a decline from PMF +3.95 to PMF +1.80, but both scores are top pairing numbers. Stralman was given bigger defensive responsibility when he joined Tampa Bay (paired with Hedman on the top pairing) and faced tougher QoC – that is one of the factors that could explain the decline.
Other Free Agent D-Men in 2014
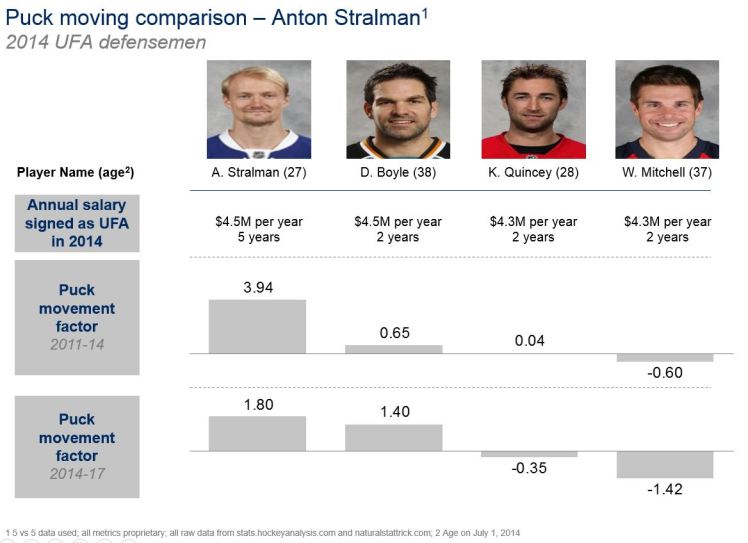
Above you’ll notice 3 other defensemen who signed new deals that off-season. The first PMF represent their ability from 2011-14 (i.e., these are numbers you would have had access to at the time). The bottom PMF represents how they fared from 2014-2017 (i.e., used to judge how the deal “turned out”).
As a puck-mover, Stralman stands out as the top free agent option. He was paid as such both in terms and dollars, but it’s probably worth discussing the Rangers’ thought process – who elected to let Stralman walk and sign Dan Boyle instead. While Boyle carries upside on the power play, his ability as a possession driver did not compare to Stralman’s (PMF of +0.65 from 2011-14). While those numbers are very solid – one must also factor in age (Boyle was 38 at the time) and potential decline.
While it looks like Boyle actually improved as a puck mover, you’d need to consider the role he was given in New York. Boyle was highly sheltered (40% O-Zone starts vs 25% D-Zone starts) and faced solid QoC – but weaker than he faced in San Jose (played 2nd pairing at 5v5 with Marc Staal). Comparatively, from 2011-14 in San Jose, Boyle was paired with M. Vlasic on the top pairing, facing higher QoC and not benefiting from as favorable zone starts (34% O-Zone vs 31% D-Zone).
Regardless, given his age (27) and dominance as a puck mover (PMF +3.95), Stralman would appear to be the logical choice as a free agent target in 2014. With the Rangers signing Boyle to the same annual cap hit, perhaps they (under)valued Stralman at a lower dollar figure instead.
Dan Hamhuis
Another interesting example is Hamhuis who entered free agency in 2010 after 6 seasons in Nashville. Hamhuis’ ‘basic’ stats were also modest: averaged ~20+ points per year with a cumulative +/- over 6 seasons of +3.
Like for Stralman, our PMF tells a different story.
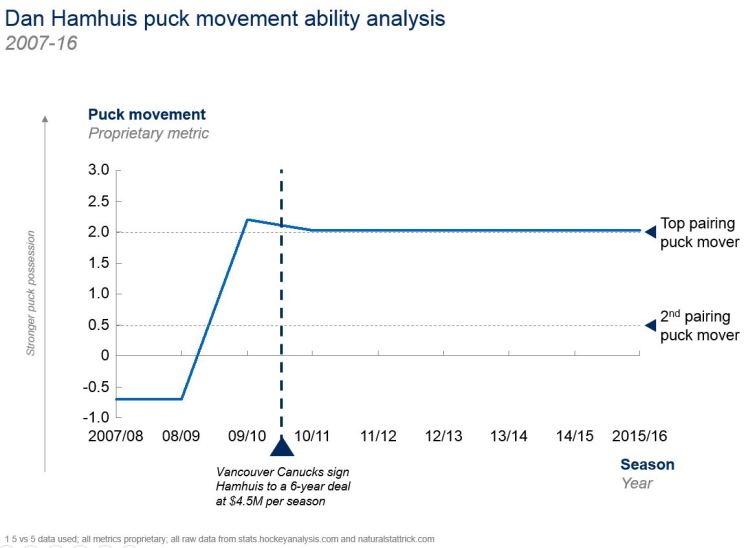
The year before free agency (2009-10), Hamhuis took a big step. His basic stats were practically identical, but his ability as a possession-driving defenseman was apparent. From 2007-2009, Hamhuis posted a modest, but respectable PMF of -0.7. In 2009-10, his PMF was +2.20 – top pairing numbers. That is dramatic improvement that is not necessarily obvious at first glance.
When you dive into his 09/10 season, the impact is clear:
WITH Hamhuis on the ice, his 2 primary D partners, K. Klein and C. Franson had CF% of 49.6% and 61.1%.
WITHOUT Hamhuis on the ice, Klein and Franson’s CF% drop to 46.9% and 49.8%.
The Canucks signed Hamhuis to a 6-year deal at a reasonable cap-hit of $4.5M – and Hamhuis hasn’t disappointed since. His average PMF from 2010-2016 was +2.02. That is akin to a top pairing defenseman, despite facing top QoC.
Verdict
Many factors go into the evaluation of a player. One may argue that evaluating defensemen – with the exception of the Brent Burns and Erik Karlsson’s of the world – is tougher to do because basic stats (e.g., points) usually don’t tell the complete story.
Our puck movement metric is by no means perfect, but perhaps it would have pointed more teams in the direction of Stralman and Hamhuis – two defensemen who may have entered free agency undervalued, but have been lights out since.
