To date, we’ve focused on 5v5 play which makes sense since the majority of a game takes place at even strength. In our quest to build complete profiles on defensemen, we introduce our power play ability metric.
We’ve approached our analysis on power play ability from 2 angles, and built proprietary metrics for each one.
1. A defenseman’s ability to ‘QB’ the power play. This includes slowing the play, setting up teammates, and ultimately “driving” scoring chances for your team with the man advantage
Metric explanation: Our custom metric is a function of several key variables. We measure a defenseman’s ability to generate strong scoring chances and contribute with primary assists, and adjust for time on ice, quality of their defense partners, forwards, and team. The latter part is particularly important: any defenseman who runs the power play on the Pittsburgh Penguins will likely be on the ice for many scoring chances as you’re playing with Crosby, Malking, Kessel, and company. As a result, we adjust accordingly by factoring in strength of the given defenseman’s team’s forwards
2. A defenseman’s ability to ‘score’ on the power play or present the threat of being a top scorer. This usually comes in the model of an elite shot (e.g., Chara, Weber) or high end offensive ability (e.g., Karlsson, Burns, Doughty)
Metric explanation: The premise of this area is goals scored per standardized ice time with the man advantage. We felt actual goals scored on the power play is a strong indicator for either a. strong slap shot or b. high end offensive ability. Of course we made the necessary adjustments so we can compare on a larger scale and standardized accordingly.
Ideally, an ‘elite’ power play defenseman should be capable in both these areas. That said, bringing a huge spike in either area likely means you’re a true asset to your team at 5v4.
To examine this difference, let’s explore a classic example of two very different defensemen stylistically – but who both are excellent power play assets.
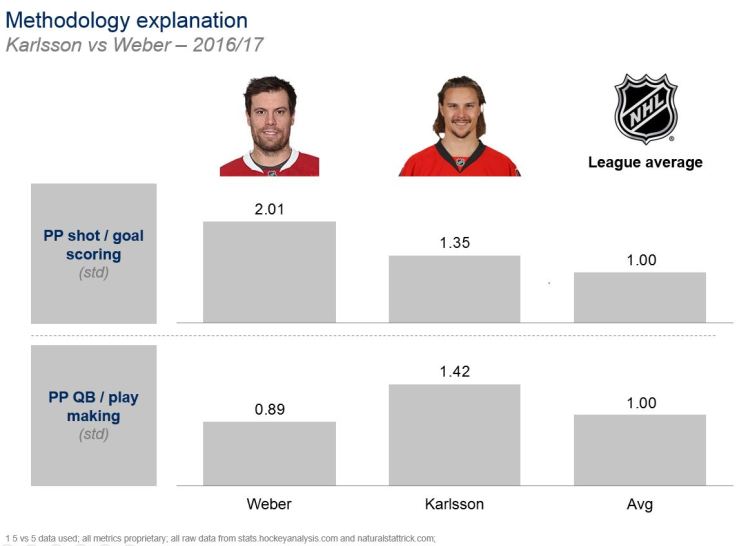
Consider Weber and Karlsson in both these areas. In terms of PP shot / goal scoring, Weber is among the best in the league with a PPGS of +2.01 (note the actual values may differ slightly from chart below – just a result of standardizing / plotting at zero axis). Karlsson is also above average posting a PPGS of +1.35. This should not come as a surprise. Weber was a rock on the Habs powerplay in 2016/17 and has a cannon for a shot, and Karlsson is one of the most elite offensive defensemen.
In terms of quarterbacking a powerplay, Karlsson shines with a PPQB of +1.42 while Weber is below average at +0.89. This too should not come as a surprise. Weber is more of a ‘finisher’ on a power play, whereas Karlsson drives the play. While both differ in their specific strengths, both are excellent power play defensemen – but for different reasons.
Now that we understand the metric, let’s take a quick look at how the top PP defensemen on the Canadian teams fared in 2016/17:

Unpacking the chart
+ The X-Axis represents the PPQB metric (i.e., a defenseman’s ability to drive possession, generate scoring chances, and make plays). Players who fall far to the rights (e.g., Karlsson, Petry, Byfuglien, Brodie) were strong in this area in 2016/17. On the other hand, players on the left hand side (e.g., Weber, Klefbom, Edler, Gardiner) were less strong at quarterbacking the power play.
+ The Y-Axis represents the PPGS metric (i.e., a defenseman’s ability to score on the powerplay). Players who are high up on the graph (e.g., Weber, Phaneuf, Giordano) are strong in this area. Players at the bottom (e.g., Rielly, Zaitsev, Markov), less so.
+ Now that does not mean that Rielly, Zaitsev, Markov don’t bring value on the power play. In fact, all 3 are above average at quarterbacking the power play. When paired with a strong shooter or offensively gifted scorers, either of the 3 could be well-suited to QB a power play.
+ The size of the circle represents average PP TOI per game in 2016/17. Shouldn’t come as a surprise to see guys like Karlsson, who plays most of the PP, dominate in this area.
Conclusion
This is another ‘tool’ in the proverbial ‘toolbox’ that can be used in the evaluation of defensemen. Coupling it with our puck movement metric, defensive ability metric, and QoC estimation, we start to paint a 360 degree picture of each defenseman.
