Our focus to date has been on defensemen, with emphasis on puck movement. As we shift to offense (and centers, first), it is important that we re-visit quality of competition and understand the slight differences when comparing forwards.
The quality of competition that a defenseman faces is based primarily on the forwards they play against. While there are some exceptions, coaches will develop game plans by matching their defense pairings against opponent forward lines.
For example, if Montreal was playing Pittsburgh, Claude Julien and his staff might decide to have Weber play against Crosby’s line as much as possible. It’s unlikely he would plan for Weber to face off against Letang. While a coach would still like his best defenseman to play against other team’s top d-men, the point is that it is less likely they plan for that.
When it comes to forwards, the approach has 2 lenses.
1) The defensemen he faces. Are they playing against top line pairs or 3rd pairing guys? That is sure to have an impact on a player’s production – regardless of who we’re talking about.
2) The opposing forwards he plays against. A Ryan Kesler or Tomas Plekanec will draw the tough assignments of facing top offensive players. That, too, will surely factor into a player’s production.
Consider this example:
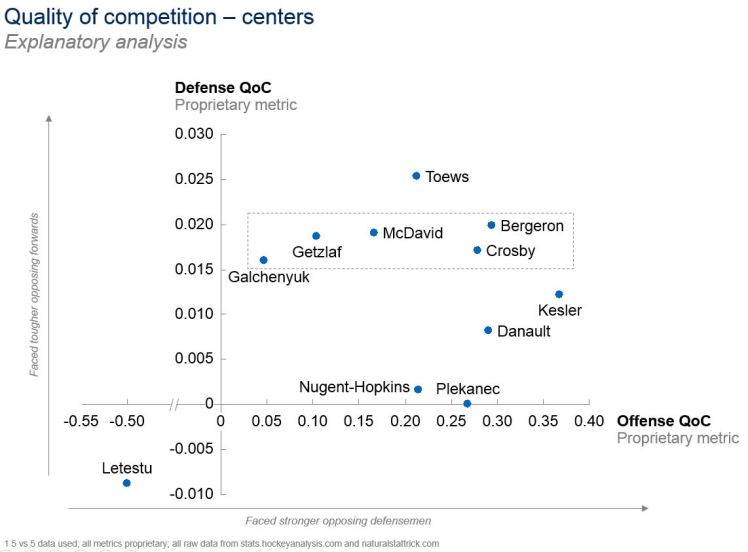
To understand the chart, the x-axis (offense QoC) refers to the quality of forwards that each player faces. It’s not surprising to see Kesler and Bergeron on the far right, as they’re routinely tasked with shutting down the top opposition.
The y-axis (defense QoC) refers to the quality of defensemen that each player faces. It shouldn’t come as a surprise to see the best offensive players in the league at the top of the chart (e.g., Crosby, McDavid, Getzlaf, Toews). This means that opposing teams are sending out their top defensemen against these players.
Consider the Anaheim example which is extremely interesting. You’ll notice Kesler on the far right (further right than Getzlaf) and Getzlaf at the top (higher than Kesler). This makes sense when you break down the Ducks. Getzlaf is the top offensive center and draws the opponent’s top defensemen. Hence his defense QoC is greater than Kesler’s. On the flip side, Kesler is often tasked with shutting down the opponent’s top line. As a result, his offense QoC is greater than Getzlaf’s.
As we go team-by-team, we can factor both layers of QoC into the equation. As a quick example, we can take the players in the dashed-box (they all faced similar defensive QoC) and compare how each fared, offensively, in that situation:

***Note: League avg. are still being refined as some of the metrics are new, but it should still be directionally indicative. Furthermore, league averages refer to all players – these may be skewed higher as players who faced much weaker QoC will have higher scores.
Quick overview of the metrics:
+ Possession driving factor measures a center’s ability to elevate the play of his teammates and generate scoring chances (it is proprietary and standardized)
+ Scoring chance generation compares a center’s ability to generate high quality scoring chances per 5v5 ice time, and adjusts for zone starts, as well as quality of team and teammates (also proprietary and standardized)
+ 5v5 goal scoring and playmaking are standard, but informative, statistics. They refer to goals scored and primary assists achieved per 60 minutes of 5v5 ice time
You see the dominance of some of the league’s top centers. Even Galchenyuk (although he struggled as a possession driver – i.e., to make his teammates better, as well as defensively) put up some solid offensive numbers against strong defensive QoC).
When comparing players, it is important to create an apples to apples comparison – i.e, an even playing field. QoC creates imbalance on the playing field. For example, consider two players with similar offensive statistics – are they equivalent players? Maybe. But if one faced 3rd pairing defensemen on average while another faced the Shea Weber and Zdeno Chara’s of the world – we’re not comparing two similar situations. While it’s impossible to create perfect comparisons, layering QoC into the analysis gets us much closer.
