The Florida Panthers have a solid young defense group led by Aaron Ekblad. Down the middle, former 2nd overall pick Aleksander Barkov leads the charge. But given Barkov’s injury history, depth down the middle is paramount for Florida. Today we take a look at – and break down – their top 4 pivots.
***Note: For detailed methodology and other deep dives, please feel free to check out our home page here.
Quality of Competition
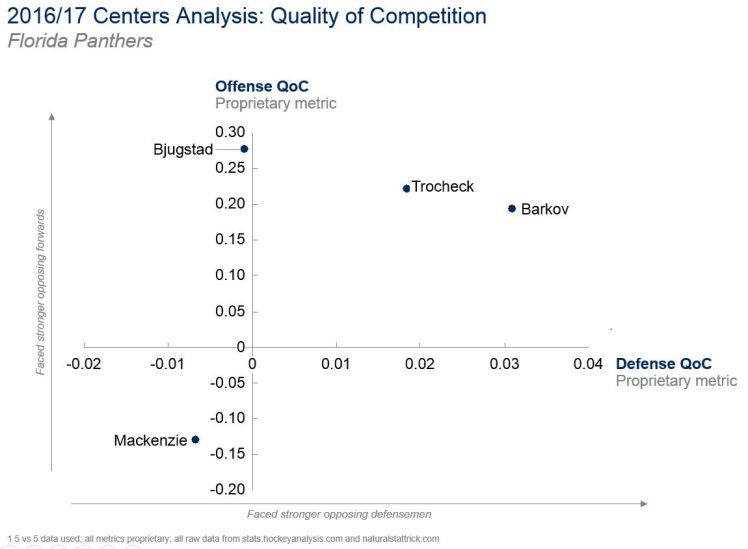
The Y-Axis (offense QoC) represents the quality and strength of opposing forwards that each center faces. Being higher on the graph means you face tougher opponents. Typically, you’ll see clear differences between the centers (indicating very different roles and assignments). With the Panthers, Barkov, Trocheck, and Bjugstad all faced similarly tough opposing forwards. One rationale is because of injury. Bjugstad and Barkov each missed 20+ games. For example: If Barkov was the coach’s choice against opponent’s top lines, then when he was injured – Trocheck and/or Bjugstad would step into that role and take that assignment.
The X-Axis (defense QoC) represents the quality of defensemen that each forward faces. Here the split makes total sense. Barkov represents the biggest offensive threat for the Panthers, centering Jagr and Huberdeau (when healthy). Coaches no doubt matched up – when possible – with their top defensemen. Trocheck, centering the 2nd line – and the first with Barkov out – also faced tough opposing d-men. Mackenzie, as you can observe by both his offensive and defensive QoC, played 4th line minutes.
Defensive Ability
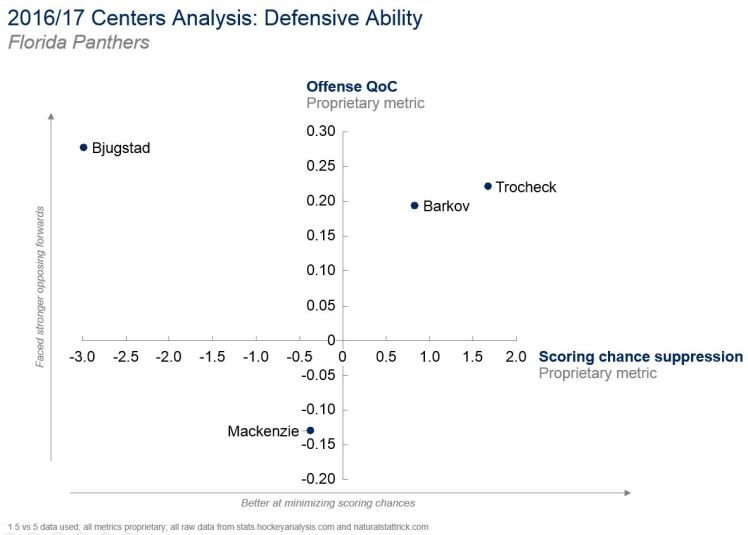
The Y-axis (offense QoC) will match the previous chart, representing the quality of forwards each faced. The X-axis (scoring chance suppression) is our new defensive metric that measures a center’s ability to minimize opposing scoring chances.
Both Trocheck (SCS +1.69) and Barkov (SCS +0.88) were strong defensively, representing their ability to play a solid 200 ft. game. Don’t let Trocheck’s (minus) 13 +/- fool you: he was rock solid both ways, playing big 5v5 minutes for Florida.
While our model accounts for – and adjusts – based on linemates, Barkov’s defensive score may be hurt slightly playing with Jagr and Huberdeau – 2 offensively gifted players not known for their defensive prowess.
Bjugstad fared poorly defensively in 2016/17, sparking off-season speculation he would play wing next season. I would advise caution there: Bjugstad had an injury-riddled season with his play dropping considerably in all areas from his impressive 2015/16. Big centers don’t grow on trees and Florida might be wise to let Big Nick start as a 3rd line pivot in 2015/16, and take it from there.
Offensive Ability / Possession Driving
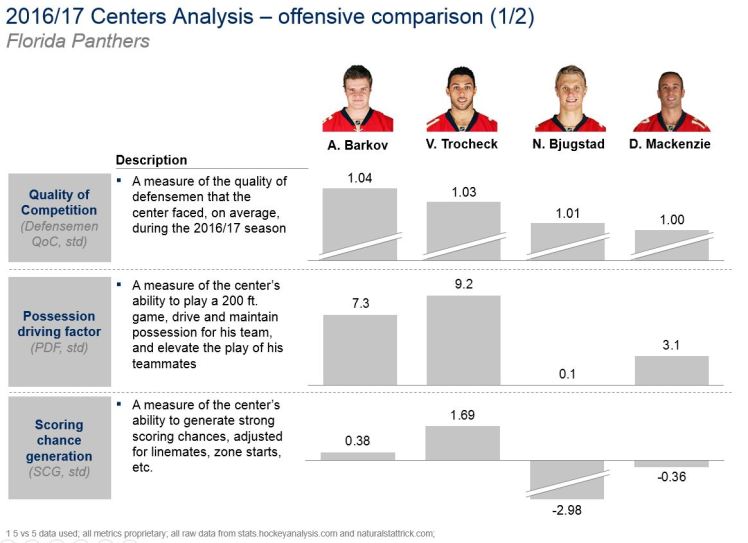
When looking at offense, the QoC represents the quality of defensemen each player faced (previously the x-axis on the QoC chart, standardized here to highlight differences).
Trocheck was particularly dominant as a possession driver (PDF +9.2) and at generating scoring chances (SCG +1.69). Some might have been surprised when the Panthers inked VT to a 6 year, $28.5M contract in July 2016 – but after last season, that looks like a steal. Not only did Trocheck play a responsible 200 ft. game, but he consistently helped his line maintain possession and was the primary driver for scoring chances (playing with Jokinen and Smith).
Consider his impact on his linemates: Rielly Smith and Jussi Jokinen’s possession numbers (CF%) were 8% and 11% higher, respectively, with Trocheck on the ice.
Barkov, too, was excellent as usual in 2016/17. His ability to play a 200 ft. game and drive possession (PDF +7.3) is also among the league’s best. Barkov’s ability to generate scoring chances (SCG +0.38) is also very solid – but this metric was likely impacted by having played with Huberdeau and Jagr – two players who generate strong offense on their own (Barkov’s goals scored per game played doubled once Huberdeau returned for the final 30 games).
This is also a good time to break down “offense” even further. Generating scoring chances is obviously important – but ability to finish matters as well. For example, if player A generates 10 scoring chances per game but scores 1 and player B generates 5 scoring chances per game and scores 3, we’re likely talking different “skill sets”. The ability to capitalize on opportunities and make the high impact play carry tremendous importance.
To round out this context, consider the following:

We plot G/60 5v5 on the X-Axis and primary assists per 60 on the Y-Axis (all numbers standardized so 0.5 does not refer to 0.5 g/60 or FirstA/60).
Both Barkov (1.06 g/60) and Trocheck (0.84 g/60) were excellent at goal scoring, but Barkov’s 0.85 primary assists per 60 is in a class of its own. Barkov’s hockey IQ and elite play making / goal scoring ability separate him as one of the best centers in the entire league. Sure, playing with Huberdeau and Jagr presents an advantage over Smith and Jokinen (offensively), but the differences from chart 1 to chart 2 highlight Barkov’s “elite” finishing ability.
Verdict
The future appears to be bright in Florida. With Barkov (6 years, $35.4M, $5.9M AAV) and Trochck (6 years, $28.5M, $4.75M AAV) locked up for the next 5+ seasons, the Panthers have one of the best 1-2 punches down the middle in hockey (especially when you consider the value). Barkov is a strong #1 center, and Trocheck is a strong #2 center, who – as he demonstrated this season – can step up in the lineup if Barkov misses time.
If Bjugstad can regain his 2015/16 form and stabilize the 3rd line, and if both he and Barkov can stay healthy for a full season – both big IFs – then look for Florida to be a much improved team in 2017/18.
