Is save percentage a useful metric? Well, in theory it is. By definition, a goalie’s save percentage measures how many saves a goalie makes per number of shots. For example, a save percentage of 90% means a goalie stops 9 pucks for every 10 shots he faces. Seems useful.
But in reality, there are many other factors at play. For example, consider the quality of the team he plays for. Surely, a team that excels at keeping shots to the outside, clogging shooting lanes, and playing tight defense will make the goalie’s job easier. Another example is penalty kill. A team with a better penalty kill will limit scoring opportunities on the man advantage. Both factors (among others) impact a goalie’s save percentage and tilt the playing field. In other words, comparing save percentage across goalies – in the current format – is not an apples to apples comparison.
Our Methodology: Building our adjusted save percentage metric
To improve “save percentage”, the following approach was used. I pulled all 5v5 goalie data from 2013-2017 (4 seasons). The reason I ignored PP / PK data is because this will largely skew results (since most of the game is played 5v5, yet the % of goals is elevated with the man advantage) and be more dependent on the team’s ability to kill penalties effectively (vs the goalie’s ability).
Second, I needed a way to level the playing field in terms of the quality of shots they face. The ideal way to do this would be to scrape shot location data (which is still tracked manually – so lacks reliability anyways) and measure save percentage by shot quality location (e.g., Corsica Hockey uses low, medium, and high danger areas as their breakdown – note: I did not use Corsica data; rather, I estimated using the approach described).
Since I can’t assure the quality or reliability of shot location data (nor do I have access to it), I took an estimation approach. I used high danger corsi against as a percentage of overall corsi to estimate what percentage of overall shots come from high danger areas. I could then determine the “high danger” and “low danger” save percentages. To then even the field, I took the “best” ratio of HD shots to overall shots and adjusted every goalie’s shots faced to this level. The rationale is that if every goalie had the same team in front of them (i.e., the same quality of defense), then the ratio of high danger shots that they face would be approximately equal.
I could then measure expected goals from high danger and low danger areas, and compute each goalie’s 5v5 adjusted save percentage metric.
Is the stat repeatable?
Our 5v5 adjusted save percentage metric appears to be slightly more repeatable than normal 5v5 save percentage. Here’s what’s interesting: in either case, goalies appear to struggle to be consistent in terms of save percentage. To get a better idea of “repeatability”, we compared 2016-17 to the closer of 2014-15 or 2015-16 – the rationale being that 2 closer years within 3 might be a better representation of consistency.

The R2 of 0.05 improves slightly on unadjusted 5v5 save percentage (R2 = 0.04) using the minimum variance approach I described above and a little more significantly using just 2 years (R2 = 0.01).
A sneak peak at the past 4 Vezina winners

I plotted where each goalie ranked in their respective Vezina winning season relative to other goalies (and looked at the same rank using standard save percentage (which includes 5v4 game play and no adjustments). To understand the plot, consider S. Bobrovsky. His 2016-17 adj. sv % was 94.8% which ranked 4th highest in the league. Using general save percentage, he ranked number 1.
In the case of Bobrovsky, Holtby, Price, and Rask, the numbers are pretty similar. This isn’t surprising. These are the vezina winners – of course their save percentages will look good regardless of which metric one uses. In other instances, this approach provides key insights. Consider the 2017/18 current rankings (as of 26 Dec, 2017):

Rapid Fire Observations
+ Brian Elliott (94.6% Adj. Sv) is an excellent example of how this metric provides deeper insight. Looking at Elliott’s overall save percentage this season (0.916), one might conclude that Elliott has been solid, but unspectacular. In fact, Elliott’s been a great bright spot on the Flyers. His ‘overall’ numbers are driven down by a terrible penalty kill (Philly ranks in the bottom 5 at under 80%), but 5v5 Elliott has excelled. His HD save percentage of 80%+ is very solid.
+ Not surprising to see Andrei Vasilevskiy ranked at number 1 in the entire league. In addition to a high flying offense, AV has played a key role in Tampa’s success.
+ Aaron Dell (94.3% Adj. Sv) is having a tremendous season as San Jose’s backup. What’s even more interesting is that Dell ranked among the top last year, too (2016-17 95.5% adj. save %). Undrafted and already 28 years old, could another team make a move to pry away Dell in the hopes he can prove to be a late-stage diamond?
+ On the less positive side, Murray, Price, Anderson, and Talbot’s sub-par play has something to do with each of their team’s not great starts. Are they the only ones to blame? Absolutely not. But each is playing at a level lower than last year and good goaltending is critical in today’s game.
Price vs Rask
We looked at two Eastern conference stalwarts: Carey Price and Tuuka Rask over the past 4 seasons.
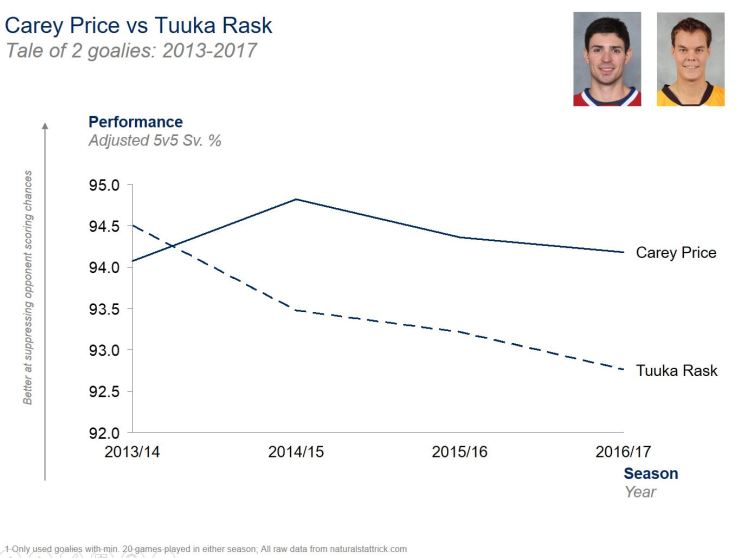
Tuuka Rask appears to be on the decline since his Vezina winning season in 2013-14. Price, on the other hand, has been his consistent spectacular self since 2013-14. Note that I used an average for Price’s 2015/16 season as he played fewer than 20 games.
From Boston’s perspective, this can’t be reassuring news. Rask is still only 30 and these numbers trend in the wrong direction. Khudobin has been especially solid this season so it will be interesting to monitor the situation moving forward.
From Montreal’s perspective, Price has had a completely atypical 2017-18 season. His 91.9% adj. sv is well below his 4 year average of 94%+. The biggest driver of this decline is Price’s high danger save percentage. Typically, Price’s HD SV% has been 80-85% (according to my estimate). Corsica hockey has those same numbers in the mid-high 80’s too (so the estimation appears to be in the right ball park. This season, Price’s HD save percentage is ~10% lower.
Given Price’s consistency over the past 4 years, we cannot yet conclude he is “declining”, but the rest of 2017/18 (and next year) will be interesting.
Verdict
Save percentage remains one of the go-to ‘general’ stats used to evaluate goaltenders. Advanced hockey pundits have done great research towards improving in this area. In my case, adj. 5v5 save % represents a first approach at improving in this area. Although there are clear next steps to refine this analysis, this metric creates an ‘improved’ apples-to-apples way of comparing goaltender performance and making player personnel decisions.
