Draft and develop is often a term you hear next to <insert successful team here>’s success. Drafting well is paramount in the salary cap era and the reason for that is simple. Getting strong production at ‘entry level salary’ is excellent value and gives you the luxury of allocating the excess money to other areas. Teams content with overspending in free agency will find themselves in cap trouble and have no choice but to let even stronger players leave unsigned.
Today we take a crack at building our version of “draft pick value” and then look at some pick for pick trades from the 2017 NHL entry draft. Here’s a question: is it ever worth trading up? We explore.
Methodology
Data
We pulled draft data from the years 1996-2013 (18 seasons). While it’s true that draft picks taken in, say, 2013 will not have “full careers”, their relative production to date could still be indicative (e.g., Nathan Mackinnon’s 206 points is relatively lower than 1st overall picks 5+ years ago who could have a full career of production, but that would be the same for picks 2, 3, 4, and onwards – so we kept 2013). Optimal approach would likely have been to cap it at 2010 or so, but we kept 2013 to incorporate some more recent data.
For each player, we tracked position, points, and games played.
Model
Let me start off with a disclaimer. The ideal way to do this would be to profile each player individually and use that data. But that would require too much time for the amount I have available! So instead, I started by looking at how games played and points each varied with different picks in the draft.
For each (points and games played), I took the average for that pick across 18 seasons. I then took a moving average to smooth out odd years (e.g., the average for year N would be 0.6*N + 0.2*(N+1) + 0.2*(N-1)).
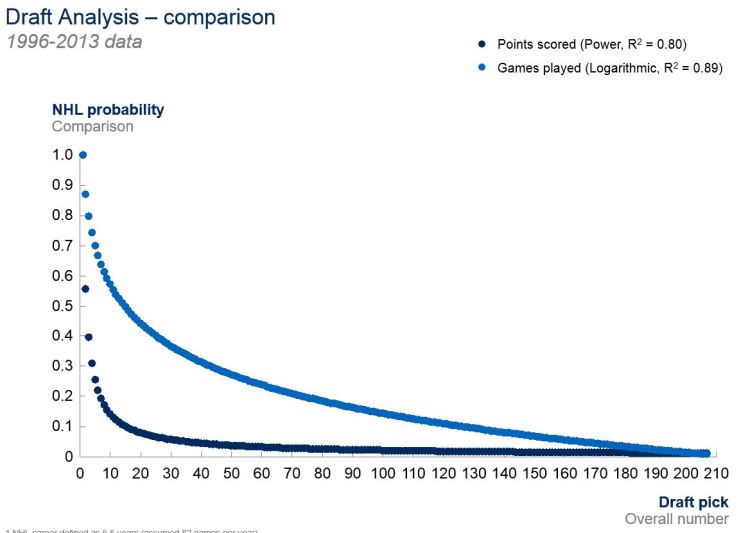
I then plotted each against pick number (see below).


The results are quite interesting. When looking at points, there’s a significant drop from the early picks. This makes sense as top, elite scorers are hard to find (but most drafts will have 1-2 “sure things”. Games played tells a slightly different story. The drop off from number 1 to 10 is less steep. My rationale for that is while it’s no certainty top picks will turn into elite scorers, there’s at least a good chance they’ll be average or below average NHLers (and play many more games than they score points).
That difference is more apparent when plotted against each other below. Here’s what that looks like using predicted values (points was a power function, games played a log function).
I then worked to build an overall model that accounts for both. I took the following approach by position (again, this approach is an approximation for what would be the more optimal – and lengthy – approach of profiling every player in detail).
Goalies: games played
Forwards: points scored
Defense: 80% x games played + 20% x points scored
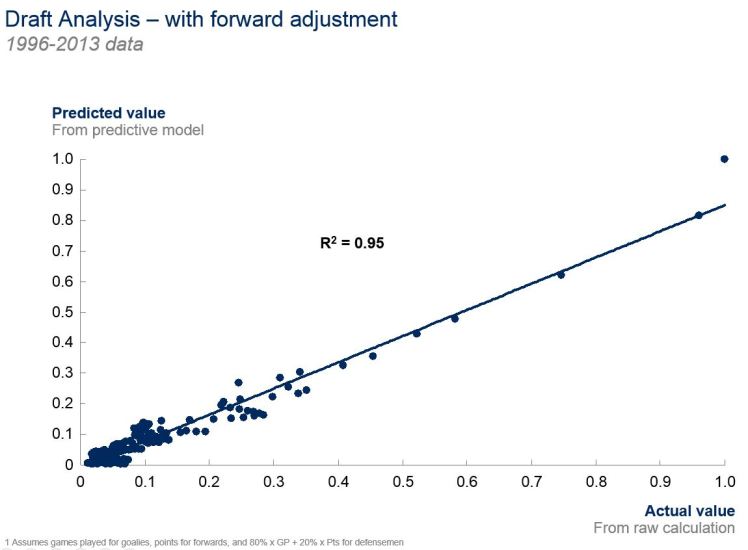
I then ran the same approach with averages and weighted averages, and plotted vs pick number. I noticed that when trying to fit with a log or power function, it overstated or understated parts of the data. This makes sense as we included both games played and points – both of which behave differently (see above). So instead, our final model was best fitted as a combination of both logarithmic and power functions. We made a small adjustment for the top 5 picks to reflect likelihood of a ‘forward’ being taken (and weighting more strongly on points / power). The overall model has an R-squared of 0.95 – which is a very strong fit.
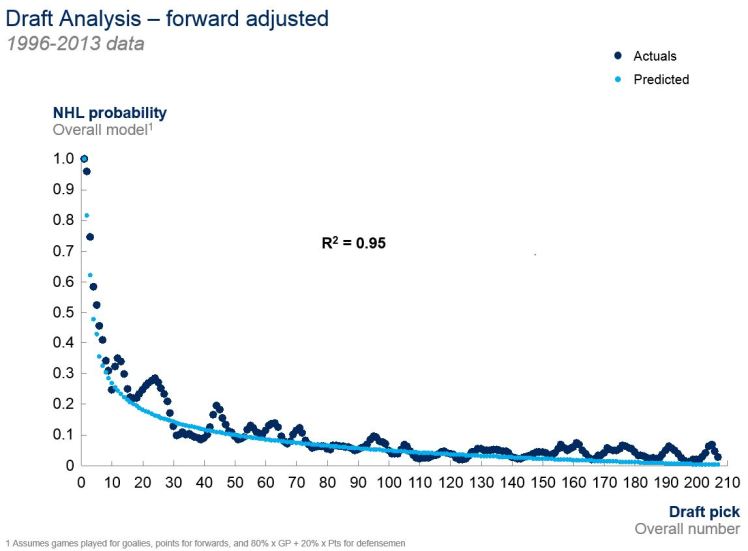
For another sense of how the predicted model matches the actuals, here’s the plot. Remember, the actuals here represent the average score of each pick (e.g., 1, 2, 3) over the 18 seasons per the model described above (standardized).
Value Chart
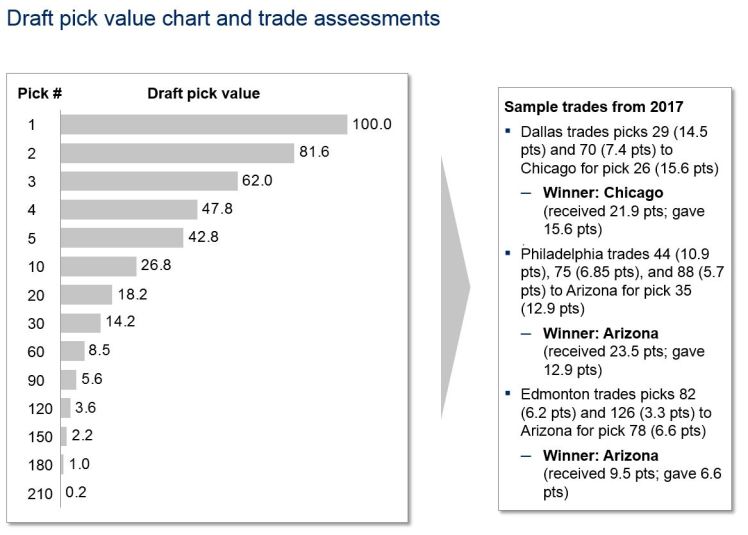
We can now use this model to assign value to each pick numbered 1 through 207. We’ve summarized some of that value below:
A couple rapid fire observations:
+ As expected, the top 3 (and really top 2) carry the most value. There’s a fairly big drop (23% lower value score) from pick 3 to pick 4.
+ The drop-off between picks as of round 3 is much smaller. Often teams will move up ~5 spots or so in the middle rounds and give up other middle/late round picks to do so. Pretty much all picks as of late round 1 are to some degree crap shoots. Picking up more picks for more “shots” seems to be a strategy supported by the numbers.
+ In all 3 trades highlighted (only focused on draft pick for draft pick trades, for now), the draft value was higher for the teams moving down (i.e., the teams trading a higher pick to get more later round picks). This doesn’t surprise me. Often teams will trade up for a player they ‘covet’ or ‘really like’, but even those guys are shots in the dark.
Verdict
Draft and development. How much credit should one get for “drafting” well vs “developing” well. The numbers point to the latter. Sure, there’s a strong correlation with finding great players in the top 3 picks. But how tough are those picks to make? Especially with today’s media coverage, the top 3 guys are getting touted a year in advance. Were the Oilers geniuses in their selection of McDavid? Or the Leafs in picking Matthews? Any fan would’ve made those picks, too.
And in the later rounds, more players fizzle than sizzle. The percentage of finding bonafide stars – let alone solid NHLers – is low. Rather than trade up for a 3rd round pick they really like, teams might be better suited stockpiling as many picks as possible and taking more shots. Then, it’s up to the development program to help them reach their potential.
